| Wed. August 12, 2026 |
 |
|
||
|
||||
| ||||



For 154 consecutive days, the Strait of Hormuz — the channel through which roughly a fifth of the world’s traded oil and a fifth of its liquefied natural gas normally pass — has been effectively closed to commercial shipping. Since the United States and Israel struck Iran on 28 February 2026 and killed Supreme Leader Ali Khamenei, tanker traffic through the strait has collapsed by more than 90 percent, Qatar has lost roughly a sixth of its LNG export capacity for years to come, and Brent crude has traded above $100 a barrel (IEA 2026; Cornago and Springford 2026). By the logic of 2022, when Russia’s invasion of Ukraine sent European inflation above 10 percent and gas prices to fifteen times their historical average, this should have been calamitous. It has not been. Eurozone growth wobbled rather than collapsed; wholesale gas prices, though elevated, stayed a fraction of their 2022 peak. The puzzle is not whether Europe is more resilient than four years ago — it plainly is — but why, and whether that resilience is structural or simply a shock that, so far, has fallen harder on Asia than on Europe.
I. Europe’s Recovery: Structural Recovery or Temporary Rebound?
Growth did not collapse. That is the least that can be said, and possibly the most. Eurozone GDP expanded 3.6 percent in 2022, slowed to a bare 0.4 percent in 2023, and edged back up to 0.9 and 1.4 percent in the two years since (Eurostat 2026) — a low base that makes the subsequent recovery look more decisive than it perhaps was. Hormuz interrupted this climb in the first quarter of 2026: output fell 0.2 percent quarter-on-quarter and annual growth slowed to 0.3 percent, the currency union's first sequential contraction since the invasion year itself (Trading Economics 2026a). Growth resumed in the second quarter, up 0.4 percent.
One contraction, one expansion: two data points, both provisional, recorded on either side of a war that had not finished escalating. Extrapolating a trend from it is closer to superstition than to econometrics.
A different indicator complicates the picture rather than confirming it. HCOB’s Eurozone Manufacturing PMI reached 52.2 in April — the strongest reading in nearly four years — with every member economy above the 50-point expansion line at once for the first time since mid-2022 (Mappr 2026). Read at face value, the resilience thesis all but writes itself.
But a diffusion index answers a narrower question than it appears to: how many managers report things improving, not by how much. New Orders and Stocks-of-Purchases — the two sub-indices actually driving April’s number — are also the two most sensitive to anticipatory stockpiling. A shortage firms merely expect can lift a PMI print just as effectively as one that materialises. S&P Global's own chief economist evidently shared the suspicion, describing the print as "more a cause for alarm than celebration" and attributing it to precautionary stockpiling rather than order-book strength (Mappr 2026). Services offer a useful check, since restocking is largely a goods-sector phenomenon: the composite index, blending goods and services, was still below 50 in May (Trading Economics 2026b) — meaning the one part of the economy less exposed to the stockpiling distortion was also the one still signalling contraction. Whatever the manufacturing print is capturing, it is not obviously demand. Table 4 and Figure 6, below, lay out the complete series
Table 1. Eurozone Macroeconomic Indicators, 2022–2026
|
Year |
Real GDP growth |
Peak HICP inflation |
Mfg. PMI |
Note |
|
2022 |
3.6% |
10.6% (Oct) |
Contraction from mid-year |
Russian pipeline gas cut off |
|
2023 |
0.4% |
Falling from peak |
Sustained contraction |
Near-stagnation; mild German downturn |
|
2024 |
0.9% |
˜ 2.4% (yr) |
Contraction easing |
Recovery begins |
|
2025 |
1.4% |
2.1% (Nov) |
Sub-50, most of H2 |
Recovery consolidates |
|
2026 (H1) |
Q1 +0.3% y/y (–0.2% q/q); Q2 +0.4% q/q |
3.2% (May peak) |
52.2 (Apr, 4-yr high) |
Hormuz shock, then rebound |
Source: Eurostat, Euro Indicators and HICP releases; Trading Economics (GDP and composite PMI series); Mappr, HCOB Eurozone Manufacturing PMI. Author’s compilation.
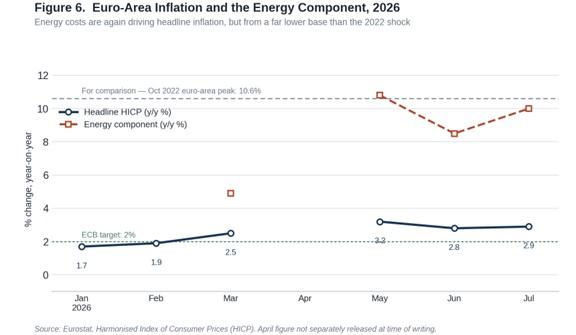
Figure 6. Euro-Area Inflation and the Energy Component, 2026
Source: Eurostat, Harmonised Index of Consumer Prices.
II. From Russia to Hormuz: Comparing Two Energy Shocks
Table 1 sets the two shocks side by side. In 2021, Russia supplied around 60 percent of EU pipeline gas and a quarter of its oil and refined products; the invasion of Ukraine displaced roughly 100 million tonnes of Russian oil and tripled European gas prices, pushing TTF to an all-time record of €342 per megawatt-hour in August 2022 and headline inflation to 10.6 percent that October (Cornago and Springford 2026; Eurostat 2022). On some measures the Hormuz closure is the larger disruption: it is withholding around a fifth of global oil supply and a comparable share of global LNG (IEA 2026), against the roughly 100 million tonnes of Russian oil that Western markets lost in 2022. Cornago and Springford (2026) argue that a sustained closure implies a worse oil shock than 2022 — and Brent has moved accordingly, climbing from around $64 in January to a peak above $103 in May (Figure 4), a proportional rise comparable to 2022’s. Gas has behaved quite differently. TTF spiked to roughly €70 intraday in early March before settling through the summer in the €45–60 range (Figure 5) — around a fifth of the 2022 peak. The reason is structural, not accidental: although Qatar carries a fifth of global LNG through Hormuz, it supplies only about 8 percent of the EU’s own LNG imports, so the chokepoint starving Asian buyers barely touches Europe’s contract book (Bruegel, cited in Janssen 2026).
Table 2. Comparing Two Energy Shocks — Russia–Ukraine (2022) and the Strait of Hormuz (2026)
|
Dimension |
Russia–Ukraine shock (2022) |
Hormuz crisis (2026) |
|
Trigger |
Russia’s invasion of Ukraine, Feb 2022 |
US–Israel strikes on Iran, 28 Feb 2026 |
|
Supply affected |
˜60% of EU pipeline gas; ˜25% of EU oil imports (Russia’s pre-war share) |
˜20% of global oil supply; comparable share of global LNG (Hormuz transit) |
|
Peak oil price |
Brent averaged ˜$99/bbl for 2022; import prices +˜50% |
Brent peaked above $103/bbl (May 2026) |
|
Peak gas price (TTF) |
All-time record ˜€342/MWh (Aug 2022) |
˜€70/MWh intraday (Mar 2026) — about one-fifth |
|
Peak euro-area inflation |
10.6% (Oct 2022) |
3.2% so far (May 2026) |
|
GDP impact |
Growth slowed to 0.4% for full-year 2023 |
Q1 2026: –0.2% q/q; rebounded to +0.4% q/q in Q2 |
|
Manufacturing PMI |
Sustained contraction through 2023 |
Rose to 52.2 (Apr 2026) — highest since 2022, though flagged as stockpiling-driven |
|
Chokepoint / shipping |
Gradual pipeline curtailment; no single chokepoint |
Acute chokepoint closure; tanker transits down >90% |
|
Emergency policy response |
˜€540bn EU-wide, largely untargeted |
More mixed: targeted measures in France; untargeted VAT/duty cuts in Spain, Italy, Poland |
Source: Cornago and Springford (2026); Eurostat (2022, 2026); Trading Economics (2026a, 2026b); Mappr (2026). Author’s compilation.
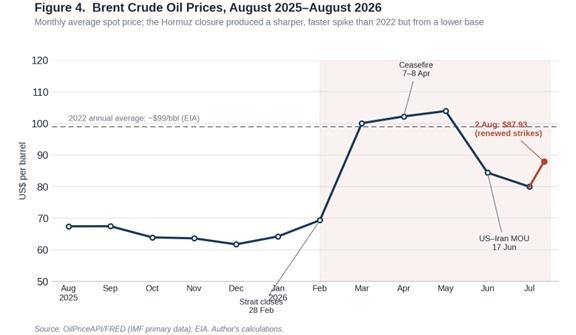
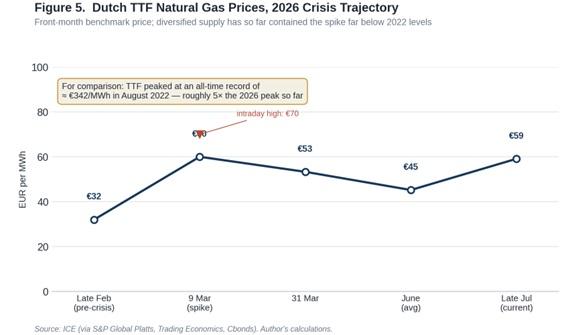
Figure 5. Dutch TTF Natural Gas Prices, 2026 Crisis Trajectory
Source: ICE, via S&P Global Commodity Insights and Trading Economics. Author’s calculations.
III. Beyond Russian Gas: Europe’s Diversification Revolution
That insulation was not built with Iran in mind; it was built to replace Russia, and it happens to generalise. Table 2 traces the reordering of Europe’s suppliers: Russia’s share of EU gas imports fell from roughly 45 percent in 2021 to about 12 percent in 2025, Norway grew into the largest single supplier at close to 30 percent, and the United States quadrupled its volumes from 18.9 to 75.6 billion cubic metres — a rise IEEFA expects to make it the EU’s top supplier outright in 2026 as Qatari volumes falter (Council of the EU 2026; IEEFA 2026). Pipeline gas imports fell by 41 percent between 2021 and 2025 even as total imports rose, because LNG — a globally traded, ship-borne commodity rather than gas fixed to a single pipe — now covers roughly half of EU gas imports, up from about a fifth in 2021 (IEEFA 2026). The infrastructure to absorb it expanded alongside the demand: EU regasification capacity grew by 76 bcm between 2021 and 2025, to 242 bcm a year, with another 100 bcm due by 2030 (European Commission 2026). None of this required sanctioning Moscow specifically: it required redundancy — multiple suppliers, multiple contract structures, spare import capacity built for one purpose and repurposed for another. Diversification, not decoupling from any one adversary, is doing the analytical work.
Table 3. Europe’s Natural Gas Imports by Supplier, 2021 vs 2025/26
|
Supplier |
2021 |
2025 / early 2026 |
Trend |
|
Russia (pipeline + LNG) |
˜45% of imports (150.2 bcm) |
˜12% of imports (36 bcm, 2025) |
? |
|
Norway (pipeline) |
˜24% (79.5 bcm) |
˜30%, largest single supplier (89.3 bcm, 2025) |
? |
|
United States (LNG) |
˜6% (18.9 bcm) |
˜25% of imports (75.6 bcm, 2025); 57% of EU LNG specifically (Q1 2026) |
? |
|
Algeria (pipeline) |
˜10–11% of total imports |
˜18–20% of pipeline imports specifically |
? |
|
LNG (all sources) |
˜22% of total gas imports |
˜50% of total gas imports |
? |
|
Note: figures compiled from the Council of the EU, IEEFA and Eurostat across slightly different reference periods and methodologies; read as indicative of direction and scale rather than a single reconciled account. |
|||
Source: Council of the European Union (2026); IEEFA (2026), EU Gas Flows Tracker.
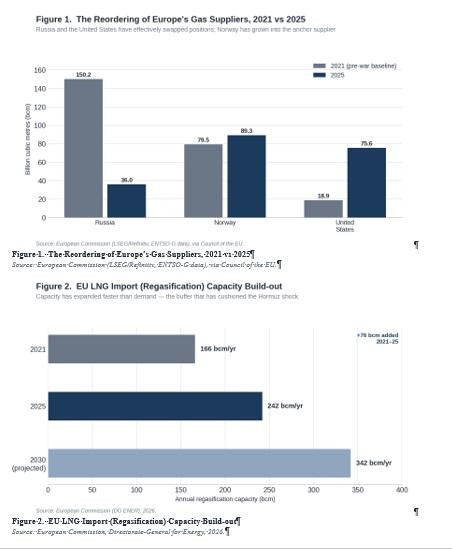
Figure 2. EU LNG Import (Regasification) Capacity Build-out
Source: European Commission, Directorate-General for Energy, 2026.
IV. The New Political Economy of Energy Resilience
Storage tells a similar story with more nuance. Europe entered the 2026 injection season around 29 percent full — a nine-year low, after a cold 2025/26 winter — but had climbed to 55 percent by late July, closing the gap on the relaxed 80 percent target that replaced the original 90 percent mandate (Figure 3; ACER 2026; Global Energy Flow 2026). The power sector has diversified too, and arguably matters more for day-to-day resilience: wind and solar generated more EU electricity than fossil fuels for the first time in 2025, coal fell to a historic low of 9.2 percent of generation, and gas’s role in setting the marginal power price has shrunk sharply in Spain, though not in Italy or the United Kingdom, which remain heavily gas-dependent (Table 3; Ember 2026a, 2026b; Cornago and Springford 2026). This political economy is not one-sided, however: Chatham House (2026) finds that the same price spike squeezing European consumers handed Moscow a fiscal windfall — Russian fossil-fuel export revenue, at its lowest since 2022 that February, rebounding sharply the moment Hormuz closed and Washington briefly eased sanctions enforcement. Interconnection cuts both ways; it always does.
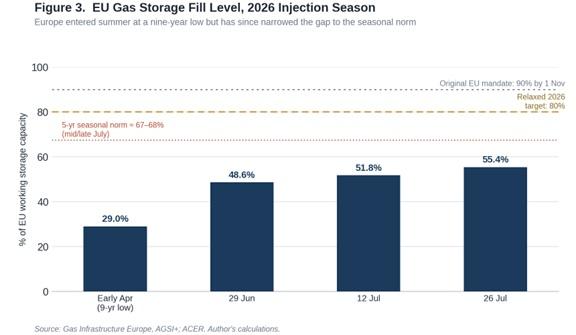
Figure 3. EU Gas Storage Fill Level, 2026 Injection Season
Source: Gas Infrastructure Europe, AGSI+; ACER. Author’s calculations.
Table 4. Evolution of Europe’s Energy Mix
Panel A — EU gas import channel (% of total gas imports)
|
|
2021 |
2025 |
|
Pipeline gas |
˜78% |
˜50% |
|
LNG |
˜22% |
˜50% |
Panel B — EU electricity generation mix (%)
|
|
2022 |
2023 |
2025 |
|
Fossil fuels (total) |
39% |
33% |
˜29%* |
|
— natural gas |
— |
17% |
17% |
|
— coal |
— |
12% |
9.2% (record low) |
|
Nuclear |
cyclical low |
23% |
recovered / broadly stable |
|
Renewables (total) |
— |
˜45% |
˜48% |
|
* Ember reports a partial uptick in gas generation in 2025 (+8% on 2024) owing to weaker hydro output, even as coal continued its decline; the finalised annual fossil share for 2025 was not yet published at time of writing. |
|||
Source: Ember (2026a), European Electricity Review 2026, and Ember (2026b), “Wind and Solar Generated More Power than Fossil Fuels in the EU for the First Time in 2025”; IEEFA (2026).
V. Europe’s New Economic Geography
None of this resolves Europe’s older competitiveness problem. Industrial electricity prices remain structurally higher than in the United States, China, or the Gulf states, where cheap hydrocarbons or state-directed energy systems continue to subsidise manufacturing just as energy-intensive processing of critical minerals becomes strategically vital. Electrification is advancing as a hedge — electric vehicles reached 17 percent of new EU car sales in 2025, up from 9 percent in 2021 (Cornago and Springford 2026, citing ACEA data) — but this shifts exposure from oil and gas prices toward electricity prices and grid capacity, rather than eliminating Europe’s cost disadvantage. China, meanwhile, is projected to still control the large majority of processing capacity for the battery-grade minerals this electrification depends on — around 80 percent of battery-grade graphite and rare earths by 2035 on current trends (ODI 2026). Europe has diversified its energy geography considerably; its industrial geography, and its exposure to concentrated supply chains generally, has diversified far less.
VI. The Limits of Europe’s Resilience
Start with the chart offering the least reassurance, if only because this article has spent the most space on its opposite number. Europe's oil import bill, not its gas bill, has moved by more this cycle: the region buys the overwhelming share of its crude abroad, and a Brent price holding near $100 works through the current account, through diesel and jet fuel, through freight costs folded into everything else — none of which shows up on a TTF line. Cornago and Springford's (2026) own comparison implies the oil shock could turn out larger than 2022's. Whether it does depends partly on pass-through, which is probably not as strong as it was four years ago — European vehicle fleets are somewhat less oil-intensive than in 2022 — though not so much weaker that the underlying point disappears.
Second: Moscow has not actually been cut off. EU imports of Russian LNG rose again through 2025 and into May 2026, with Spain roughly doubling its own purchases, at the same time Brussels was drafting legislation to ban the trade outright (Council of the EU 2026; CREA 2026). Sanctions leak precisely where the price gap makes leaking worthwhile, and Spain’s purchases look like exactly that kind of leak. The word “diversification” promises more permanence than these numbers can support — a set of substitutions that track relative prices, and that will partially reverse the moment relative prices do.
Third — and the easiest thing to lose sight of inside a document this thick with charts — none of this is actually over. An April ceasefire failed. A June memorandum of understanding failed. Washington was striking Iranian targets again by July, and the strait registered near-total shutdown in the week of 20–26 July (Lloyd's List Intelligence 2026). Storage remains below its seasonal norm this late in the injection season. And Europe's reliance on China for critical-mineral processing — the comparison reflexively reached for is Russian gas — is probably the tougher problem of the two, not its equivalent. Japan learned something like this the hard way after 2010, when a diplomatic dispute cut off its rare-earth supply overnight; more than a decade of subsidised diversification later, China still dominates the processing step, because refining capacity is a fixed, highly specific asset — a textbook case of what economists call asset specificity — not a cargo that can simply be re-routed. Gas took the EU roughly three years to diversify away from a hostile supplier. Minerals processing has resisted a comparable effort, so far, for closer to fifteen.
VII. Strategic Outlook
The resilience narrative will live or die on four things this article cannot yet answer.
Whether the second-quarter rebound survives contact with a third quarter of renewed strikes is the most immediate. A recovery that holds up through renewed hostilities is a different claim from a recovery that happened to coincide with a lull, and the data available cannot yet distinguish between them.
Storage raises a second, sharper question: not whether the EU reaches the relaxed 80 percent mark by November, but what reaching it would actually prove. A summer of contained prices demonstrates only that the system can absorb a shock in real time; a refill target met under continued strain would demonstrate something harder to fake — genuine spare capacity, not merely the market’s patience running long. That is a November question. Summer has not answered it.
Third, and under-covered relative to its importance: Qatar's own liquefaction and export capacity will not return to pre-war levels for three to five years (Cornago and Springford 2026), a constraint on global LNG balances that outlasts whatever ceasefire eventually holds. The less obvious point concerns the buyers, not the seller: long-term contracts signed elsewhere during the outage carry little commercial incentive to unwind once Doha’s cargoes return. Contracting patterns, once redrawn, do not snap back on their own.
Fourth — and less comfortable to say than the first three: the United States now supplies close to a third of the EU's gas and LNG, and Brussels has yet to reckon with whether that counts as diversification or merely a change of counterparty. A dependency on an adversary and a dependency on an ally belong in different categories — closer to Keohane and Nye's vulnerability and sensitivity than to each other — but "closer" is not "costless," and this particular dependency now sits inside a trade relationship that is contentious for entirely unrelated reasons.
Underneath all four sits a problem this article cannot fully resolve with the evidence at hand. Cornago and Springford (2026) note that European consumer demand going into 2026 was already softer than in 2022, the post-pandemic spending surge having long worked itself out — raising the possibility that this year's muted inflation reflects weak demand as much as diversified supply. On the data available, the two explanations are close to observationally equivalent: both predict a smaller price response than 2022, and nothing in this article cleanly separates how much of the outcome belongs to each.
None of which overturns the paper's central claim, only qualifies it. Structural diversification remains the better answer to why Europe absorbed this shock more easily than the last one — but "better answer" is not "settled answer," the war is not finished, and a conclusion this convenient deserves exactly the scrutiny it has not yet received.
Most commentary on this crisis is priced and dated to the news cycle. This particular constraint is not.
Vikas Bhardwaj is a scholar of international political economy, holding a Ph.D. and M.Phil. from the Centre for Russian and Central Asian Studies, School of International Studies, Jawaharlal Nehru University (JNU), New Delhi. His work focuses on economic statecraft, sanctions, energy geopolitics, and global economic governance.
He has worked as a researcher with numerous institutions, including the Indian Institute of Public Administration (IIPA), contributing to multiple policy evaluation projects commissioned by the Government of India Ministries. Bhardwaj holds nine academic degrees and has published in international peer-reviewed journals on the Russian economy, geopolitical conflict, and shifting global power dynamics.
References
ACER (European Union Agency for the Cooperation of Energy Regulators). 2026. “Key Developments in European Gas.” Ljubljana: ACER, 23 April.
Centre for Research on Energy and Clean Air (CREA). 2026. “Monthly Analysis of Russian Fossil Fuel Exports and Sanctions.” Helsinki: CREA. March–June editions.
Chatham House. 2026. “The Iran War Has Been an Economic Gift for Putin.” London: Chatham House, 10 April.
Cornago, Elisabetta, and John Springford. 2026. “Energy Shock 2.0: Lessons from 2022 for the Hormuz Crisis.” London: Centre for European Reform, 13 April.
Council of the European Union. 2026. “Where Does the EU’s Gas Come From?” Brussels: Council of the EU.
Ember. 2026a. “European Electricity Review 2026.” London: Ember Energy.
Ember. 2026b. “Wind and Solar Generated More Power than Fossil Fuels in the EU for the First Time in 2025.” London: Ember Energy, 22 January.
European Commission. 2026. “Liquefied Natural Gas.” Brussels: Directorate-General for Energy.
Eurostat. 2022. “Annual Inflation Up to 10.6% in the Euro Area.” Euro Indicators. Luxembourg: European Commission, 17 November.
Eurostat. 2026. “National Accounts and GDP.” Statistics Explained. Luxembourg: European Commission.
Global Energy Flow. 2026. “EU Gas Storage Level 2026 — Fill % vs Norm & Target.” July.
IEEFA (Institute for Energy Economics and Financial Analysis). 2026. “EU Gas Flows Tracker.” Cleveland: IEEFA.
International Energy Agency (IEA). 2026. “Strait of Hormuz.” Paris: IEA, About — Oil Security and Emergency Response.
Janssen, Rod. 2026. “New Report from Bruegel on How Europe Should Respond to the Iranian Gas Shock.” Energy in Demand (blog), 3 April.
Lloyd’s List Intelligence. 2026. “Strait of Hormuz Brief: 21 July 2026.” London: Lloyd’s List Intelligence.
Mappr. 2026. “Mapped: Eurozone Manufacturing PMI Hits Near-4-Year High in April 2026.” 4 May.
ODI (Overseas Development Institute). 2026. “Critical Minerals Geopolitics in 2026: Risks, Supply Chains and Global Power Shifts.” London: ODI.
Trading Economics. 2026a. “Euro Area GDP Growth Annual Rate.” Accessed 2 August.
Trading Economics. 2026b. “Euro Area Composite PMI.” Accessed 2 August.
A note on sourcing
All figures are drawn from named primary or institutional sources current as of early August 2026; several series (notably storage, TTF and Brent) move daily and are cited with their as-of date. Because the Strait of Hormuz crisis is unresolved, figures for 2026 should be read as provisional and subject to revision.
A note on the figures and tables
None of the four tables or six figures is decorative: each maps onto a comparison the text makes explicitly — Brent and TTF against their 2022 equivalents, the supplier reordering the diversification argument rests on, the storage trajectory the outlook section returns to, the macroeconomic panel the opening section interrogates before it trusts the headline numbers. Where a chart would not bear directly on the argument, it was left out rather than added for the sake of completeness.
| Comments in Chronological order (0 total comments) | |
| Report Abuse |
| Contact Us | About Us | Donate | Terms & Conditions |


|
All Rights Reserved. Copyright 2002 - 2026